Help Library
How To Use The Dashboard
Your Dashboard is an overview of your business. This is the first thing that you will see when you log into the system. It will outline the progress and performance of your business. Here are the potential different parts of your default Dashboard:
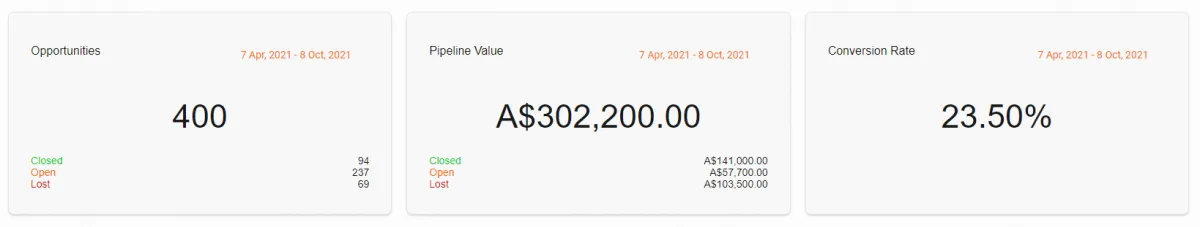
Row 1:
Opportunities - Number of Leads in your Pipeline
Pipeline Value - All your leads' total worth
Conversion Rate - Percentage of your ‘WON’ leads/accounts
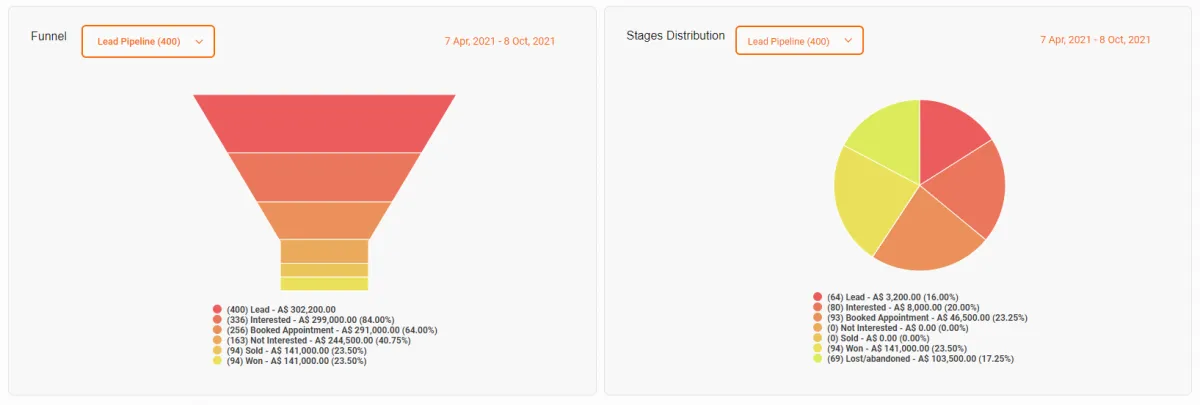
Row 2:
Funnel - A visual representation of what stages your opportunities are within your Pipeline
Stages Distribution - This is a cycle graph of your Pipeline
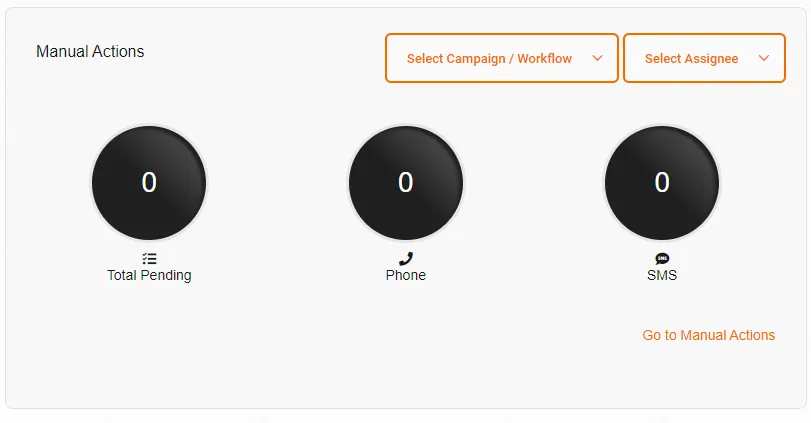
Row 3:
Manual Actions - An overview of manual actions
Tasks - A list of assigned tasks for one or all users within your account.

Row 4:
Lead Source Report - Here you can see where your leads came from and what their values are.
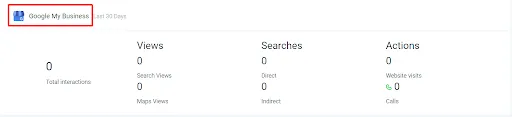
Row 5:
Google My Business - Here you can track your ranking if you have integrated GMB to your account.
Row 6:
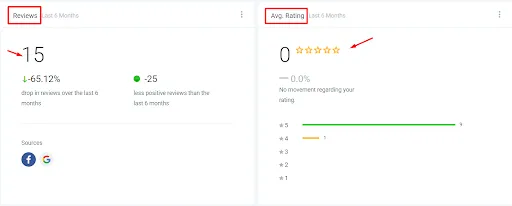
Reviews - View your total review count, review sources, and percentage of increase/decrease in number of reviews in the last 6 months as well as change factor in ratings (more or less positive in the 6 month time period).
Average Rating - A display of your average rating over the last 6 months.

Row 7:
Sentiment - Where you can see ‘Positive’ or ‘Negative’ reviews
Invites Goal - How many people have you invited to leave you a review
Leaderboard for Invites - An overview of each team member's invite count